Mastering Kubernetes Objects: A Deep Dive into K8s Building Blocks
Kubernetes is a powerful engine for containerized applications. Its smooth operation relies on Kubernetes Objects, the essential components defining what runs, where, and how – all declared in YAML or JSON. This post demystifies key Kubernetes objects: Pods, Deployments, Services, Ingress, and more.
What Are Kubernetes Objects?#
Kubernetes Objects are persistent entities representing the desired state of your application within a cluster. Instead of constantly instructing Kubernetes, you declare the desired state (e.g., "Run this container using this image, expose it on port 80, and maintain 3 replicas"), and Kubernetes works to maintain it.
Each object is defined using a manifest file (usually YAML), containing fields like apiVersion, kind, metadata, and spec.
This YAML snippet defines a Pod named mypod running the Nginx container. Let's explore key objects.
- Kubernetes objects - here is the official documentation for Kubernetes objects.
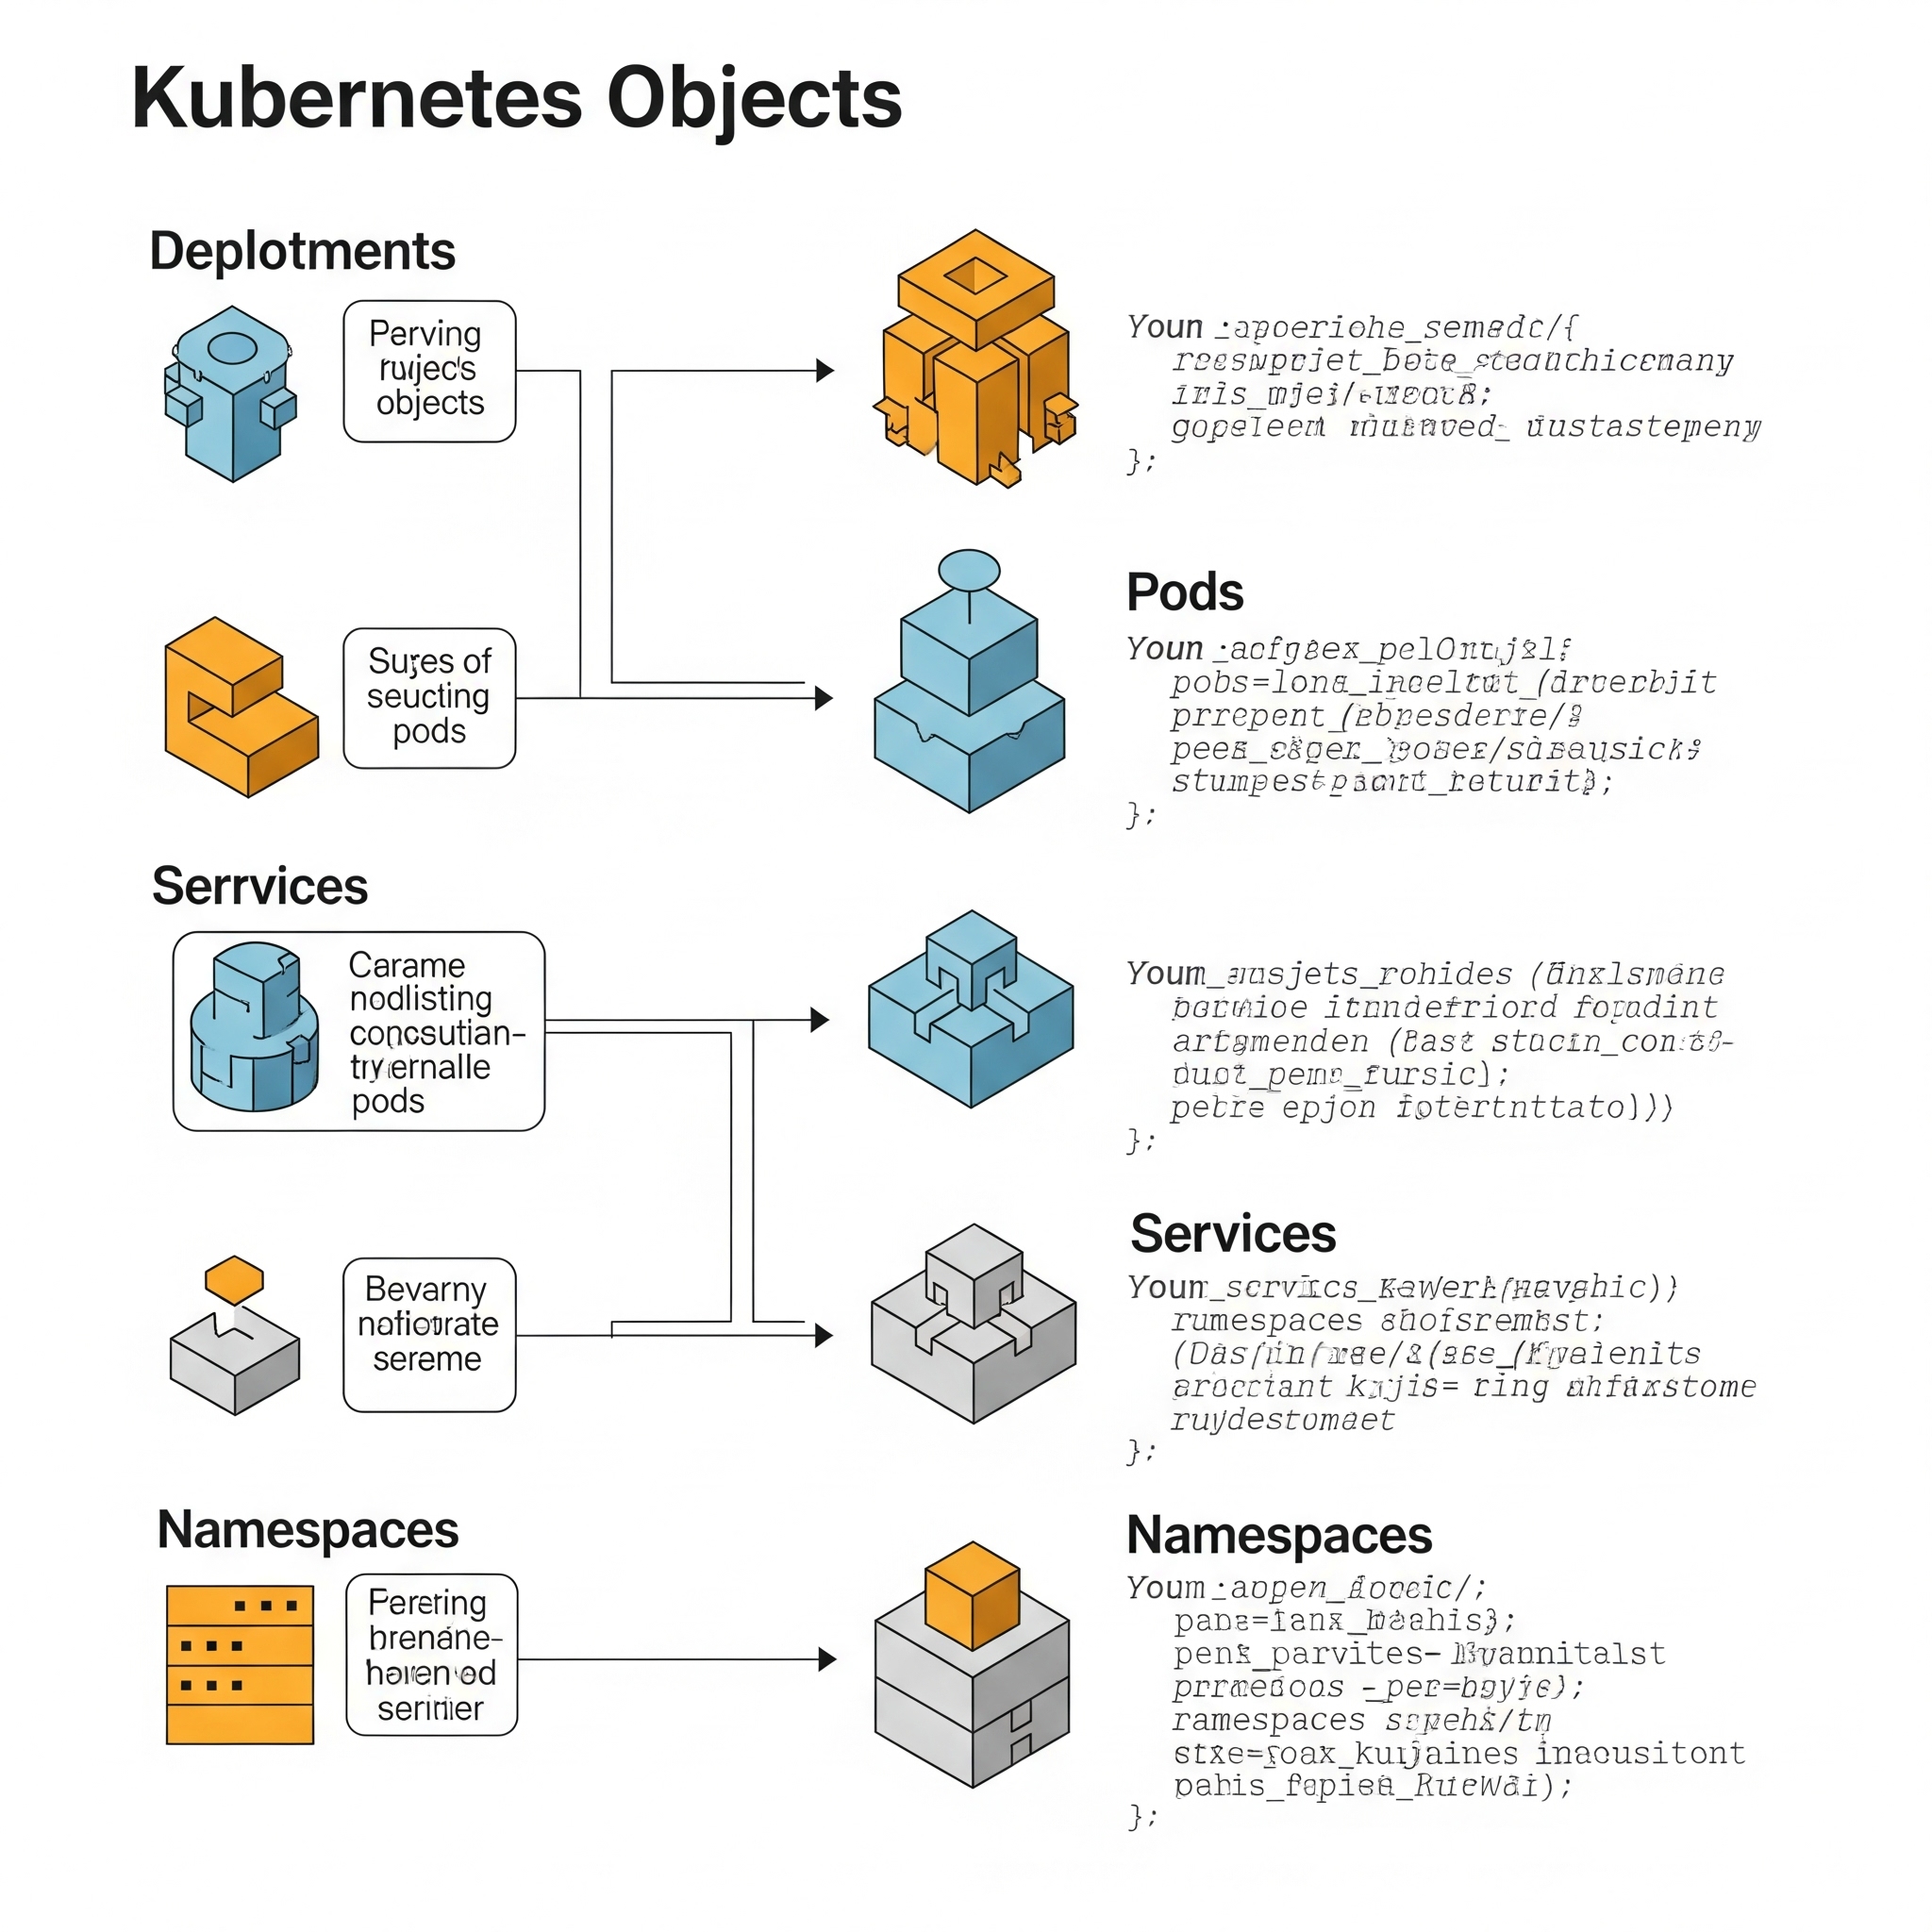
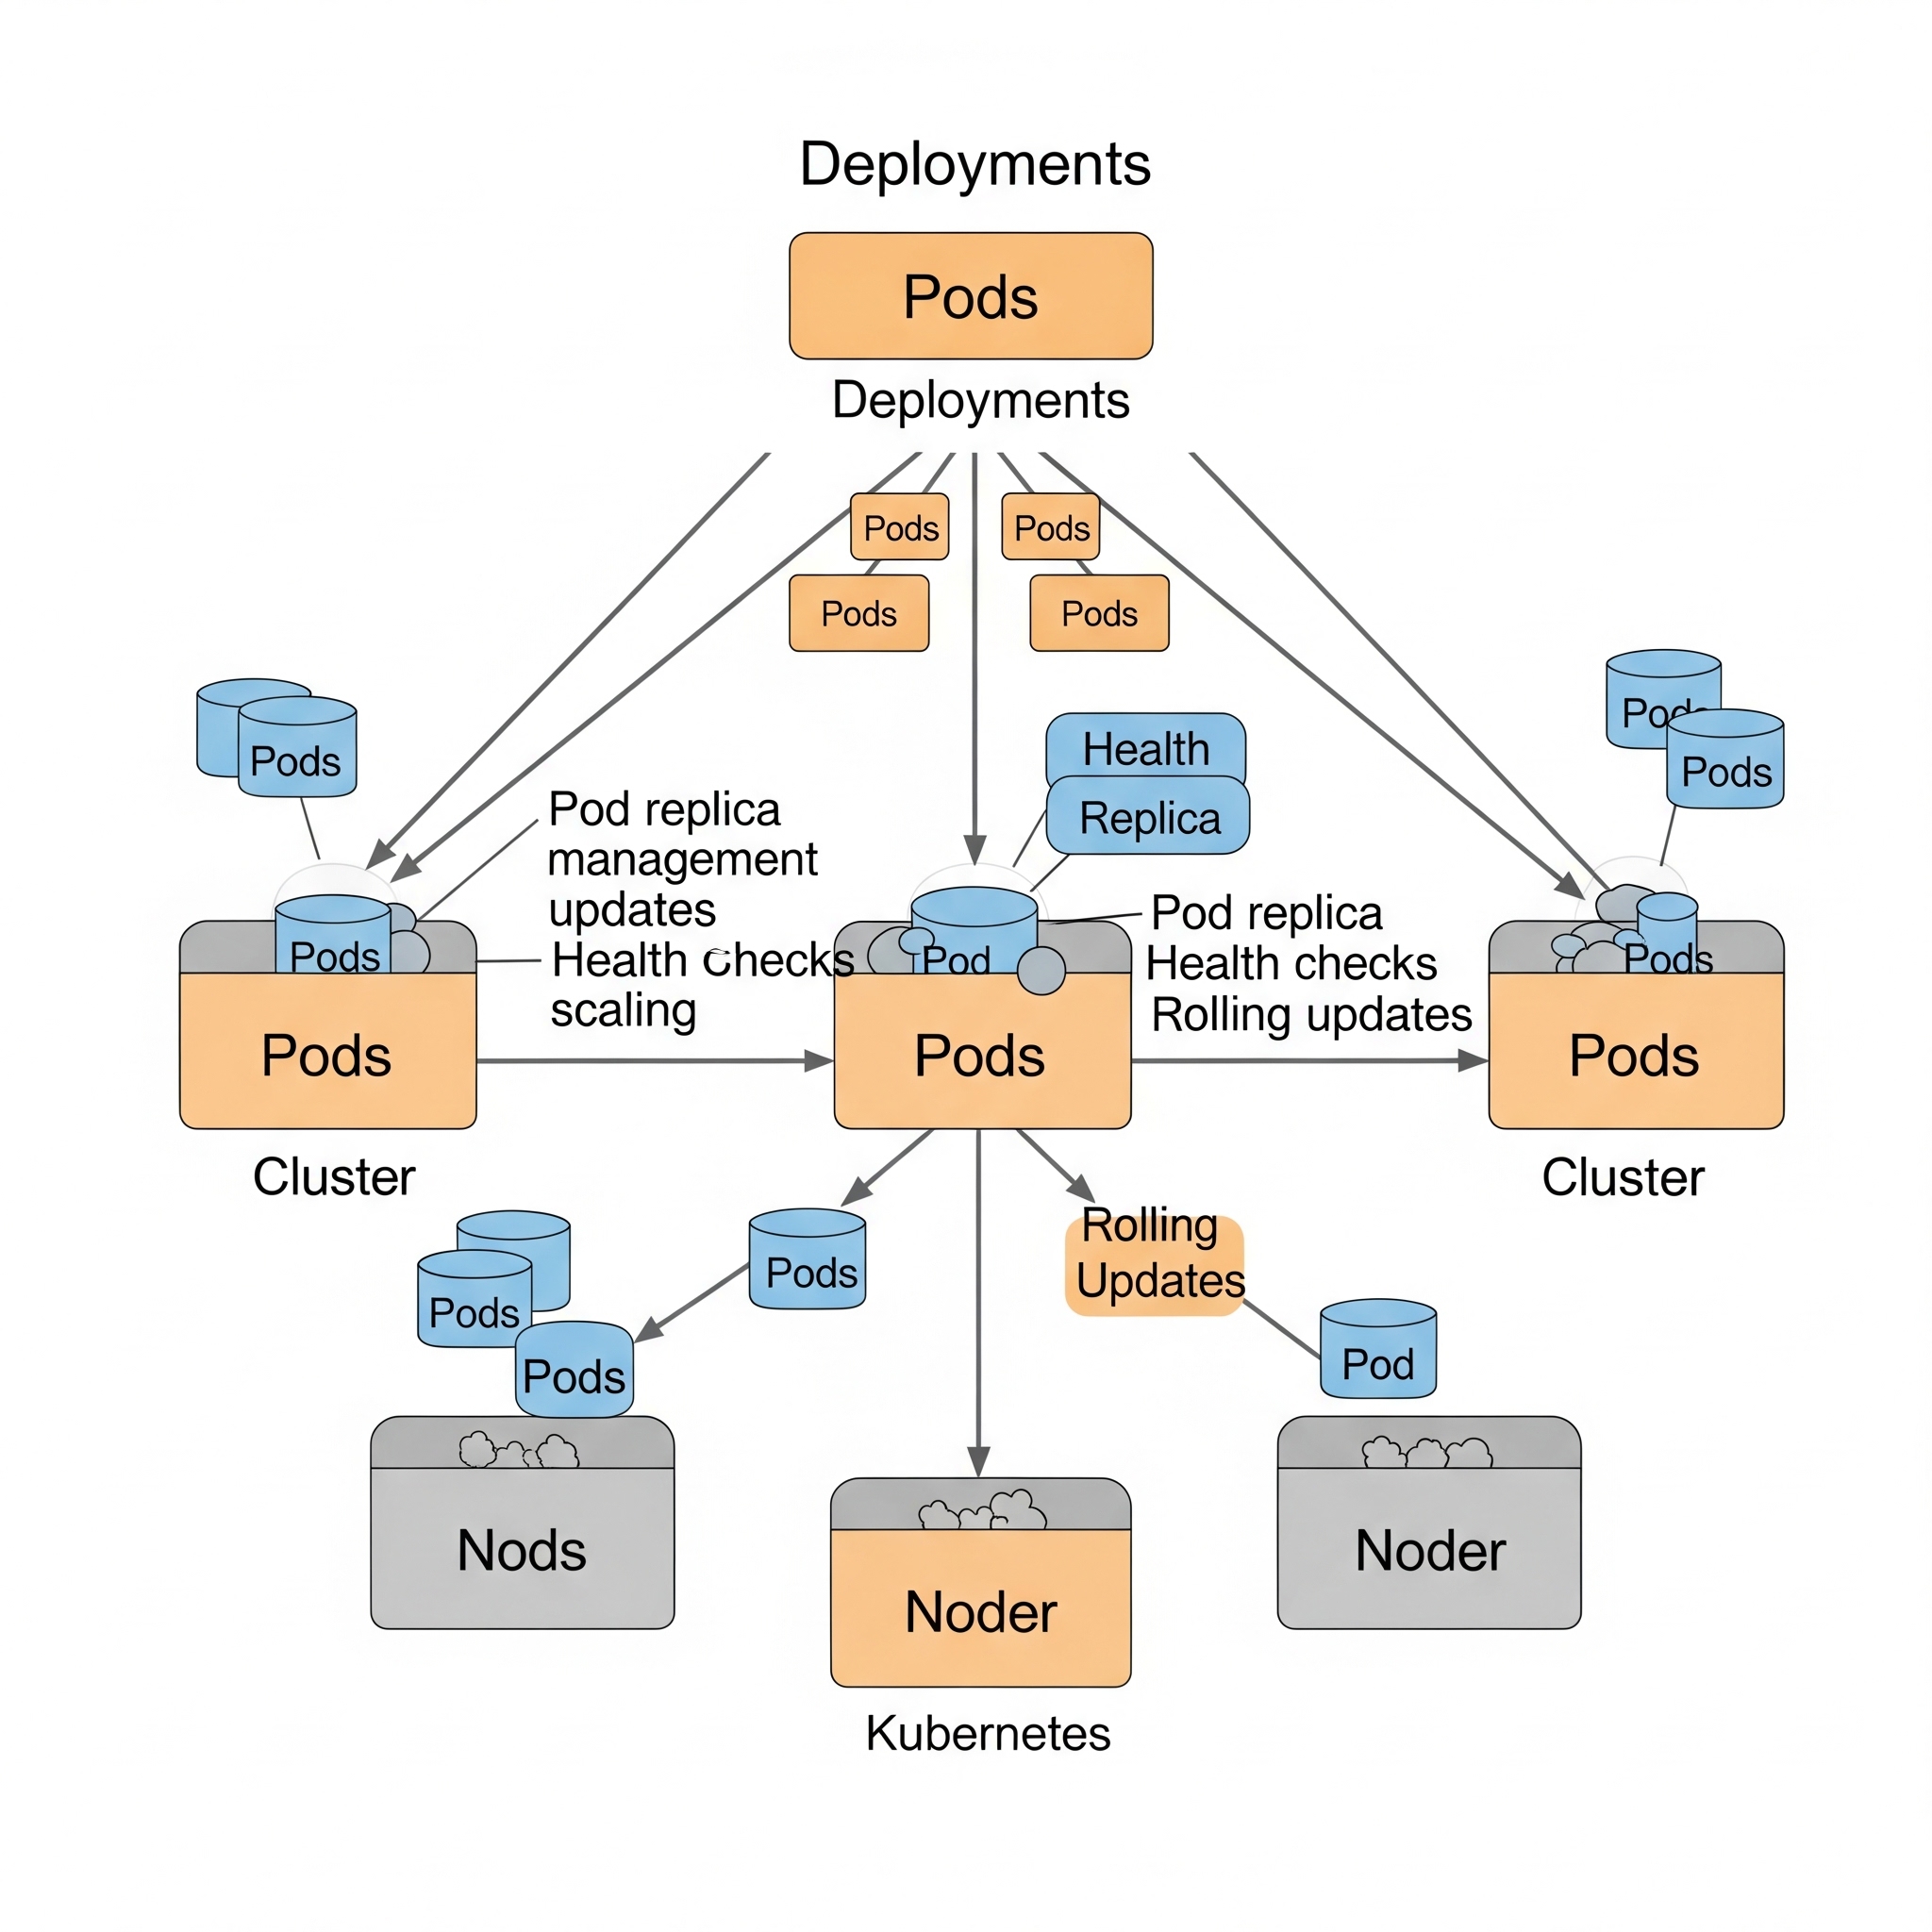
1. Pod: The Smallest Unit#
A Pod is the fundamental building block, analogous to a single apartment in an apartment complex (your cluster). It encapsulates one or more containers sharing the same network, storage, and lifecycle. Containers within a Pod are always scheduled together on the same node.
While directly creating Pods is possible, it's generally not recommended for production due to management complexities. Higher-level controllers like Deployments are preferred.
2. Deployment: Managing Replicas and Updates#
For stateless applications, Deployments are essential. They manage:
- Replica Management: Ensuring the desired number of Pods are running (e.g., 3 replicas of a web application).
- Rolling Updates and Rollbacks: Enabling application updates with minimal downtime by gradually replacing old Pods with new ones and providing rollback capabilities.
- Self-Healing: Automatically restarting failed Pods to ensure continuous operation.
Here's a Deployment manifest example:
3. Service: Stable Networking for Pods#
Key Kubernetes Objects: A Deep Dive#
This overview introduces fundamental Kubernetes objects crucial for building robust and scalable applications. We'll explore their functionalities and when to use them.
Services: Stable Access to Ephemeral Pods#
Kubernetes Pods are ephemeral; they can be restarted or rescheduled at any time, leading to dynamic IP address changes. To consistently access your application, use Kubernetes Services. They provide a stable network endpoint for a group of Pods, acting like a permanent address for your application, even as individual Pods (tenants) change.
Different Service types offer various networking capabilities. [Link to Kubernetes Service Types]
Ingress: Exposing Applications to the Outside World#
To expose your application externally, use Ingress. This object acts as a reverse proxy and load balancer, routing external HTTP and HTTPS traffic to your Services. It works with an Ingress Controller (e.g., NGINX, Traefik, AWS ALB) for actual routing.
ConfigMaps & Secrets: Secure Configuration Management#
Never hardcode sensitive information! ConfigMaps and Secrets securely manage configuration data:
- ConfigMap: Stores non-sensitive configuration data (database URLs, API keys).
- Secret: Stores sensitive data (passwords, tokens, certificates) securely, often base64 encoded.
Link to Secrets and ConfigMaps
StatefulSets: Managing Stateful Applications#
For applications requiring persistent storage and stable network identities (databases), use StatefulSets. Similar to Deployments, but provide stable storage and predictable pod startup/shutdown ordering.
Jobs: One-Time Task Execution#
Jobs are designed for batch processes requiring a single execution. A common use case is processing large datasets. The following example demonstrates a simple Job:
The restartPolicy: Never setting prevents restarts upon failure.
CronJobs: Scheduled Task Automation#
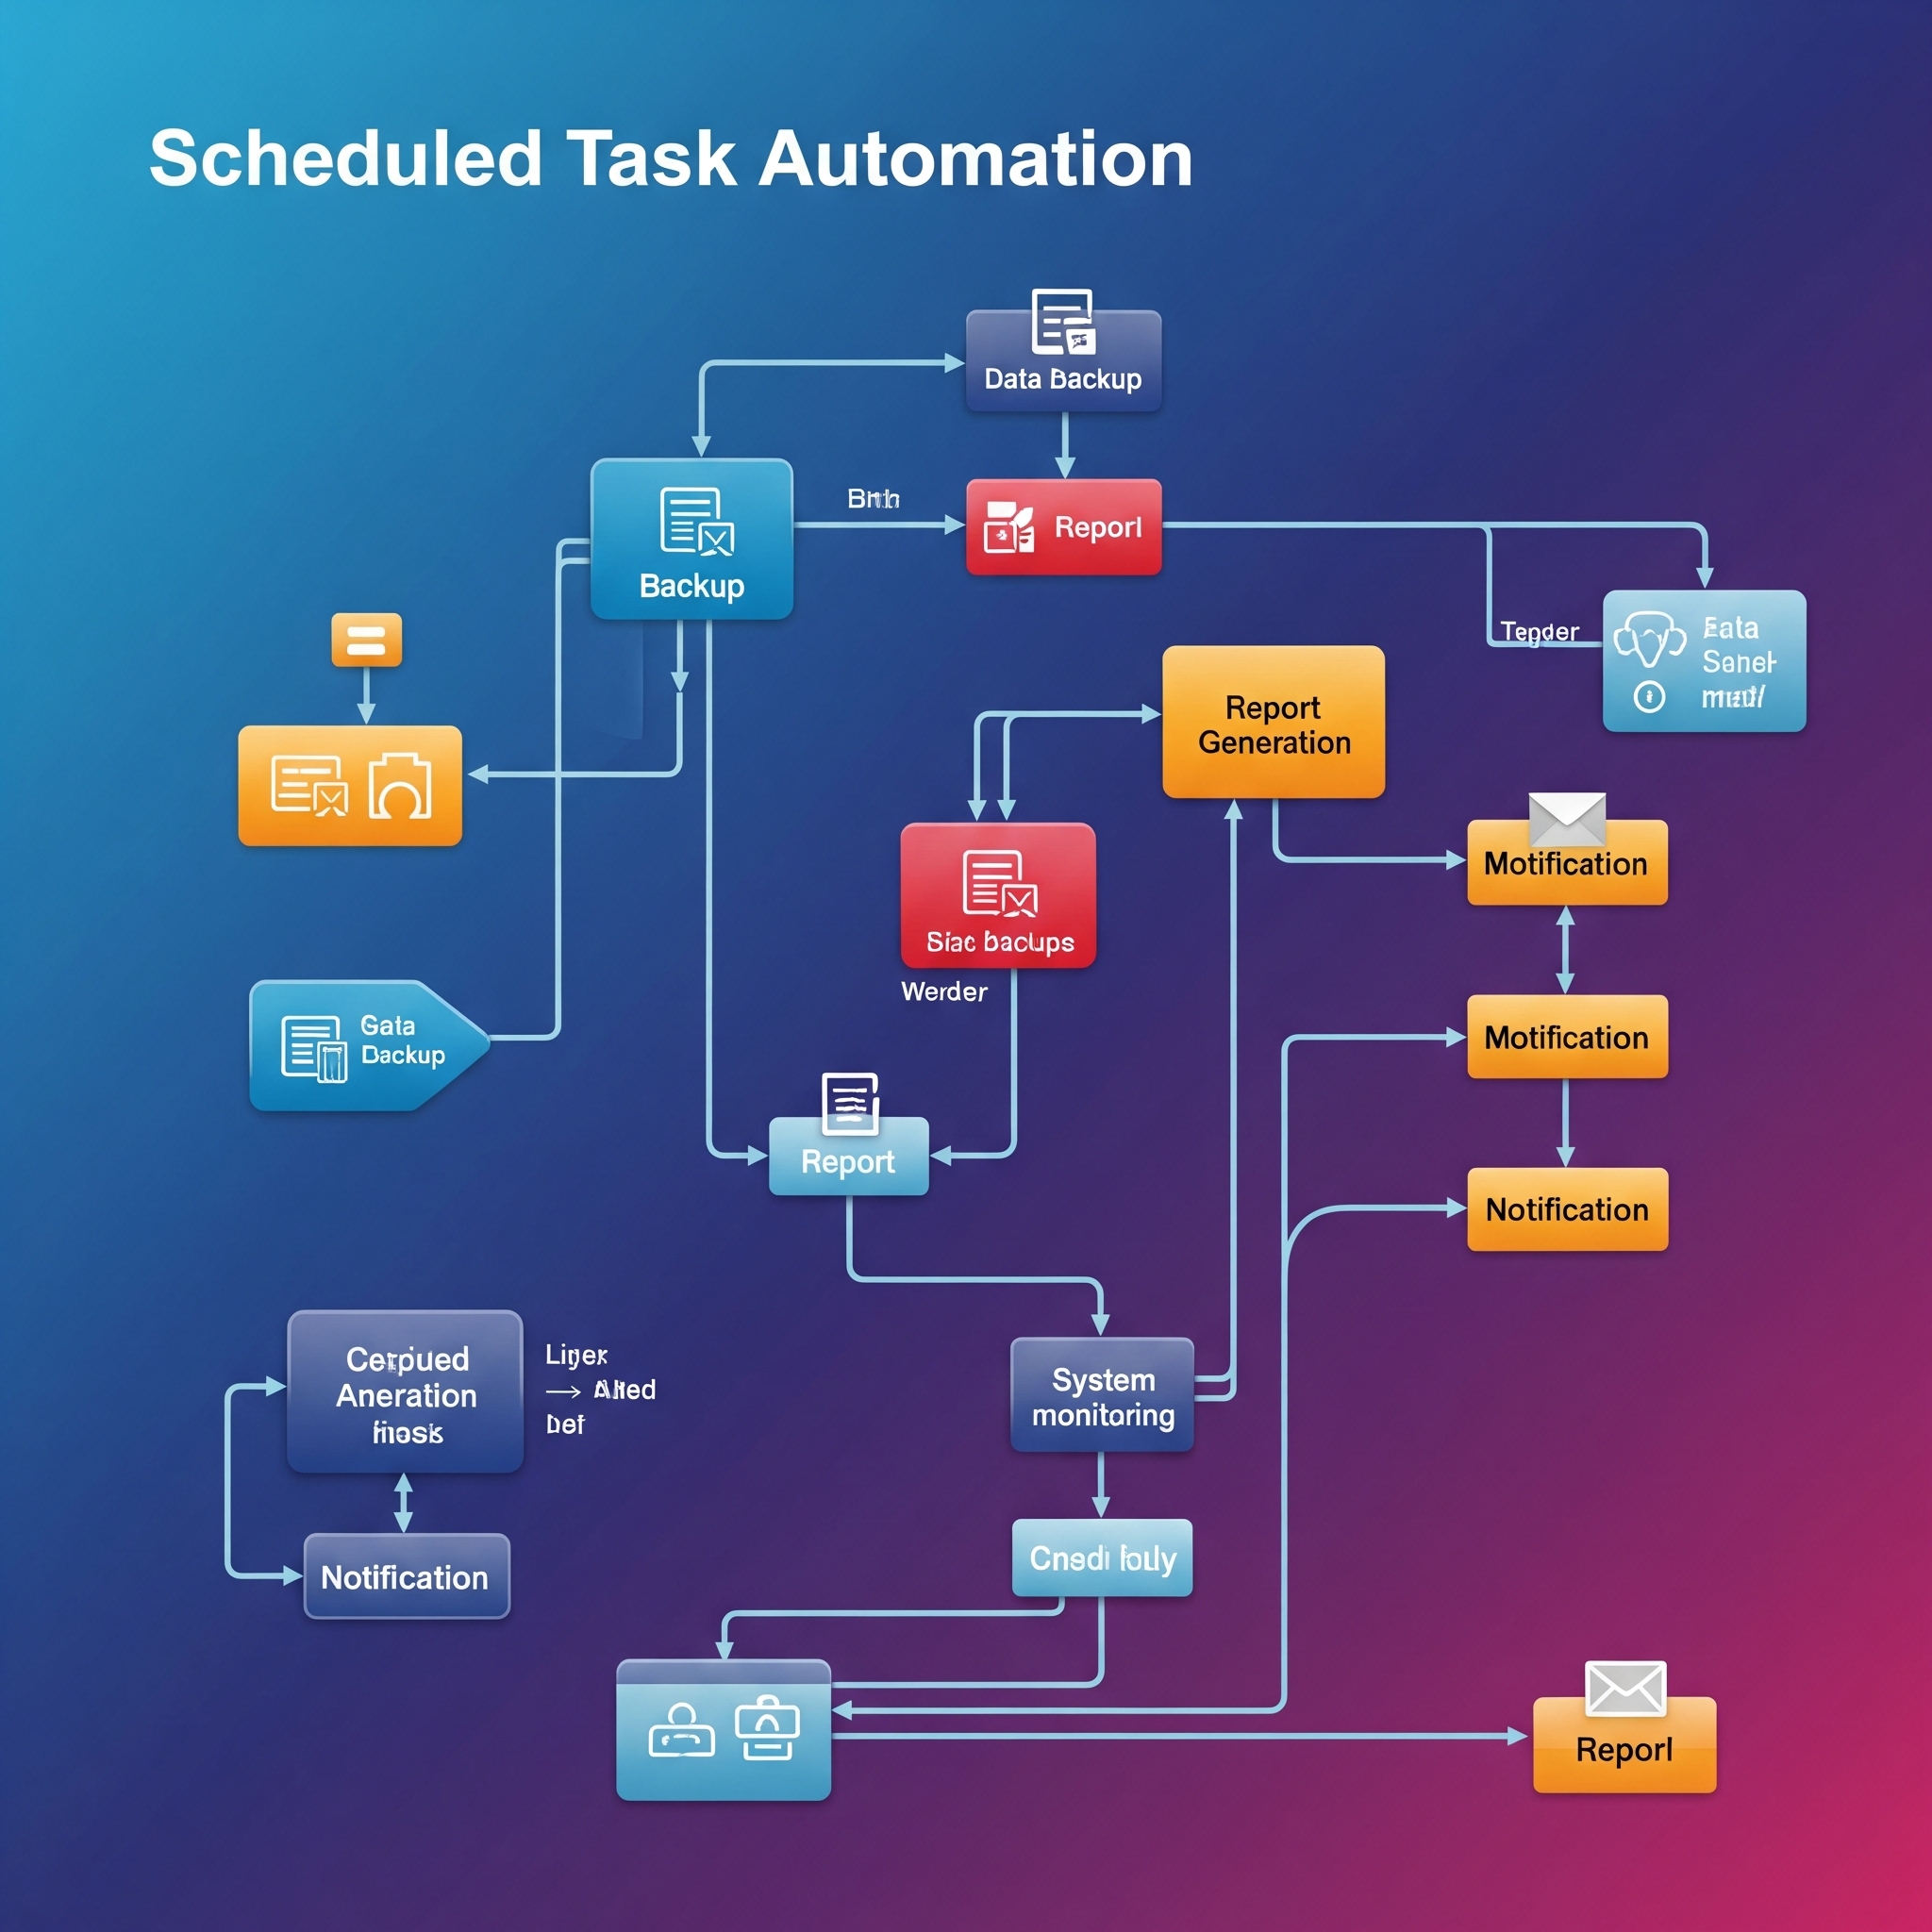
CronJobs provide scheduled task execution, similar to the Linux cron utility. This example shows a CronJob running a daily backup at 2 AM:
The schedule field uses cron syntax. restartPolicy: OnFailure enables retries on failure.
DaemonSets: Node-Level Process Deployment#
DaemonSets ensure at least one pod of a specified application runs on each node (or a subset). Typical use cases include:
- Log collection (e.g., Fluentd)
- Node monitoring (e.g., Prometheus Node Exporter)
- Storage drivers
DaemonSets are ideal for tasks requiring a process on every node, such as deploying a monitoring agent to each machine in a data center.
Namespaces: Kubernetes Organization#
Namespaces act as virtual clusters within your Kubernetes cluster, facilitating workload organization. They are useful for:
- Separating development, staging, and production environments
- Isolating deployments for different teams
Creating a namespace is straightforward:
This creates a "dev" namespace and applies the application configuration within it.
Conclusion: Understanding Kubernetes Objects#
Kubernetes Objects are fundamental building blocks. They define what you want, and Kubernetes determines how to achieve it. Understanding their roles is crucial for building robust and scalable applications.
In essence, understanding Kubernetes Objects is paramount to effectively managing and scaling your containerized applications. We've explored the fundamental building blocks, starting with Pods – the smallest deployable units – and progressing to higher-level controllers like Deployments, which simplify the management of replicas, updates, and self-healing.
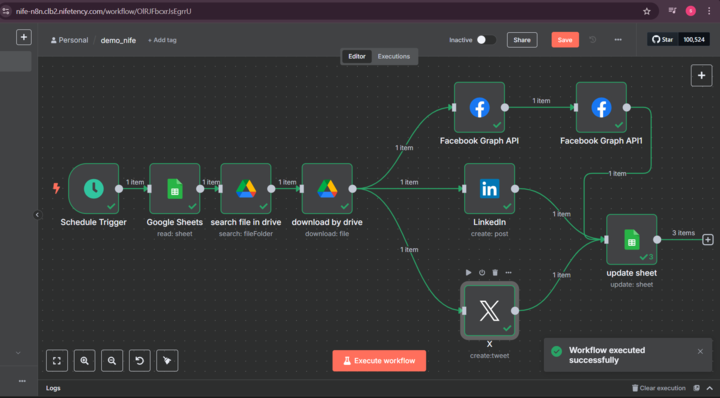
Connect Your Kubernetes Cluster with Ease Using Nife.io, you can effortlessly connect and manage Kubernetes clusters across different cloud providers or even standalone setups:
Whether you're using a cloud-managed Kubernetes service or setting up your own cluster, platforms like Nife.io make it easy to integrate and start managing workloads through a unified interface.